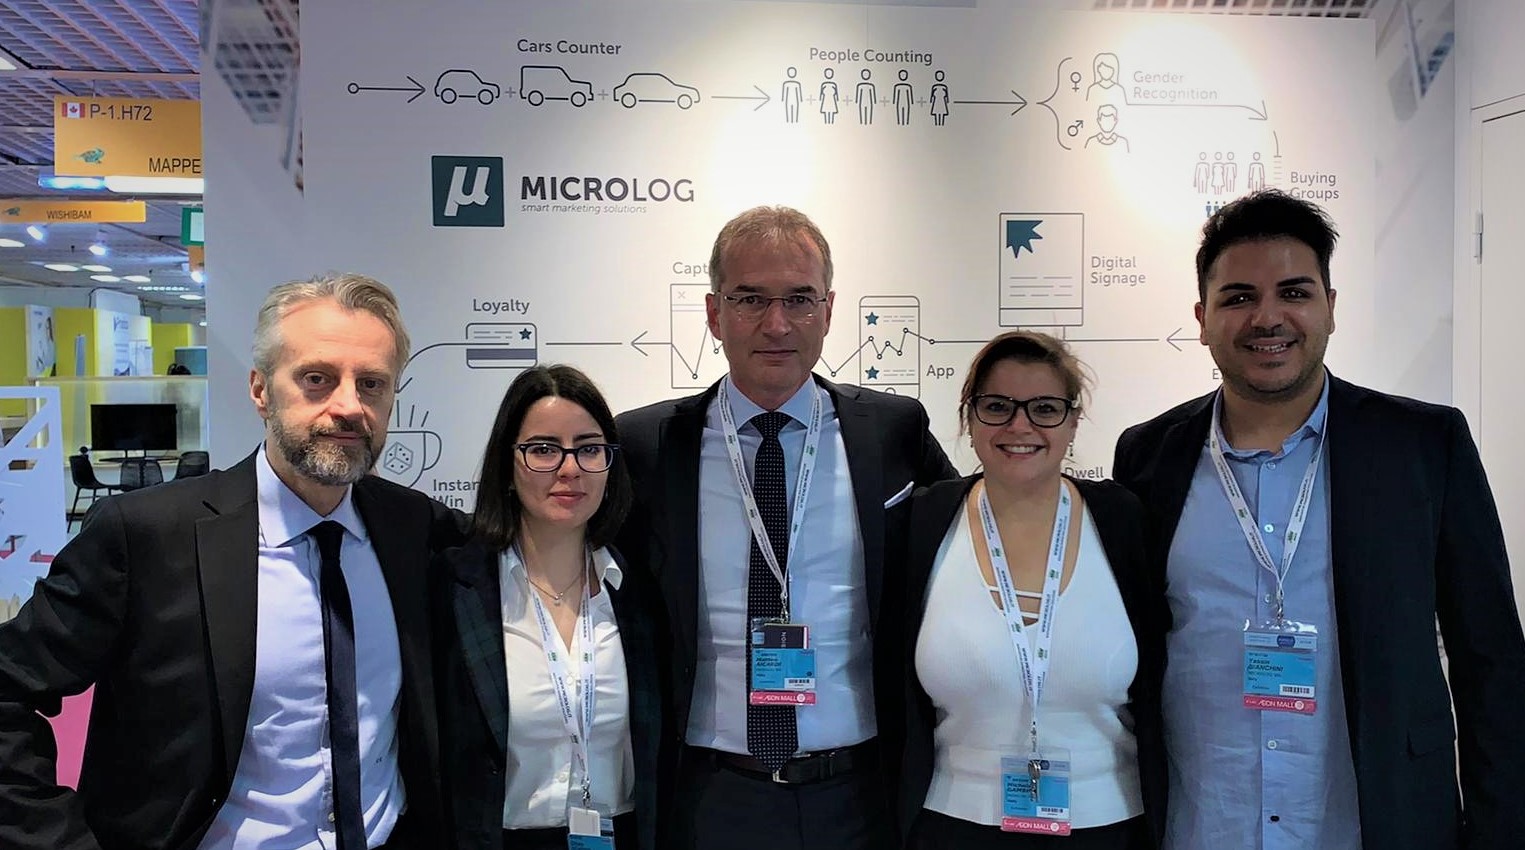
This year too we came back home from Mapic 2019 very satisfied.
We met with many new people and gladly seen again people we already knew. Alas, as globally acknowledged, fairs only allow us fast contacts: they are then one precious chance to introduce yourself and to briefly chat, but never offer you the chance to dedicate enough time and detail that any relations would need. For these reasons, at Microlog we will be very active in focusing on the new contact channels that have been opened. ?
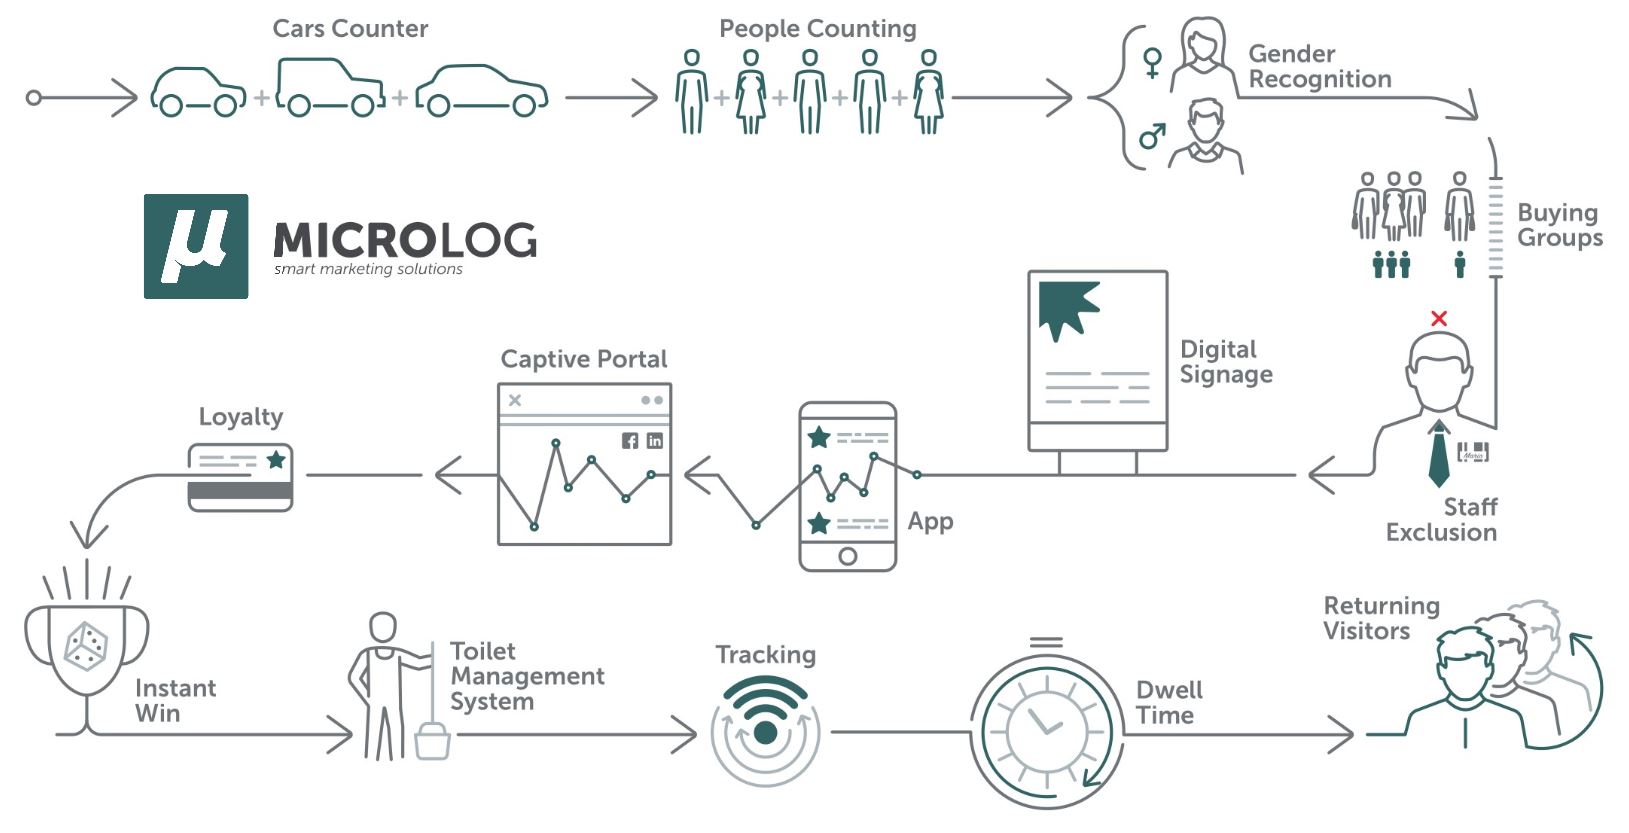
We would like to thank those who came to meet us at our booth. Someone between them maybe would have noticed the presence of some people counting tools which were exposed… and someone might remember, in particular, the stereoscopic camera which was installed on the frame of our showing space, maybe also because we have made them test the staff exclusion function.
This sensor, a part from counting people, identified groups and recognized the gender (male/female) of those that were passing beside our booth. The camera’s counting line were positioned as shown in the below image.

We catch the occasion to share with you a bit of our captured data, on a daily basis detail (the system could also go down to a 5 minutes-detail), that you will find in the following charts. The first chart reports one of the two passing direction, while the second shows the data of the opposite direction.
North Direction
| passersby | groups | % male | % female | average number of members per group | |
|---|---|---|---|---|---|
| Wednesday 13 November | 1.020 | 767 | 75% | 25% | 1,33 |
| Thursday 14 November | 910 | 705 | 72% | 28% | 1,29 |
| Friday 15 November | 119 | 91 | 76% | 24% | 1,31 |
South Direction
| passersby | groups | % male | % female | average number of members per group | |
|---|---|---|---|---|---|
| Wednesday 13 November | 1.442 | 1.101 | 73% | 27% | 1,31 |
| Thursday 14 November | 1.449 | 1.141 | 74% | 26% | 1,27 |
| Friday 15 November | 155 | 121 | 69% | 31% | 1,28 |
The data show one preferred direction: the one that leads to the Innovation Forum, that stood just in front of our booth (South direction). The people counter also reports more males than females. Moreover, the average quantity of group components were a bit more that 1, which means that the majority of people moved solely. Last but not least, data confirmed that Thursday night’s party made several victims…
We have confronted each other’s opinion: the data confirm our perceptions. To us it has been another little confirmation about the quality of the new people counting system, which were not disappointing at all, although the conditions of the installation were not optimal.
Interesting, isn’t it? ?
In our suitcases, already full of business cards, of contacts, of data and satisfaction, we also chanced to put some new ideas, that we will develop in order to give to new and stimulating projects a life! ?
All the best from the Microlog Team!


Good afternoon, I would like to know if the data regarding AI gender recognition is just a sample or it comprises the whole people passing by your booth. It’s really interesting to read that female participation was so low (a bit sad also :)) Tnx Susan
Good morning Susan and thank you for your comment!
The camera recognise the gender of each person passing by. As a consequence, the data about gender are collected over the whole people and not over a sample of them. Thus, the reported data are not affected by the rapresentativeness of the sample.
Also our perception was of a great majority of males if compared to females, but only through the counting system we have been able to provide a quantification of the phenomenon.
Have a nice day and keep follow us! ?