The Microlog application, born to monitor live presences, is updated and adds statistics for data analysis.
We are happy to announce the publication on the App Store (Apple) and Google Play (Android) of an important update to our CheckinWeb app…
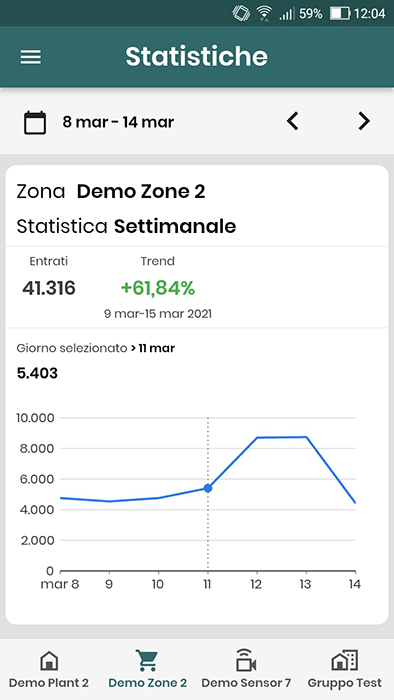
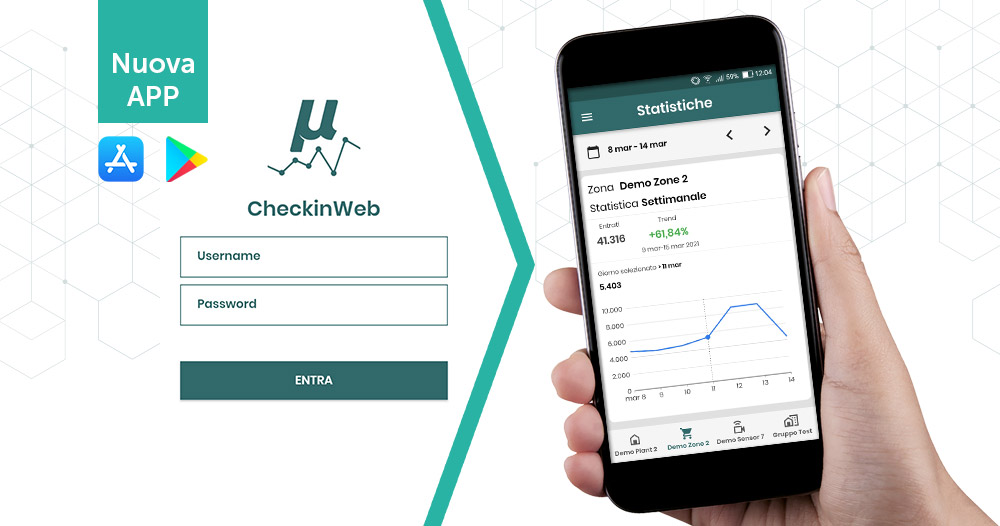
You can now access the “Statistics” section! This will allow our customers to view the number of admissions (to the shop, Shopping Centre, supermarket, etc.) recorded by our people counters, and the Trend of attendance Vs previous year, from the comfort of their smartphone.
The design and development team set itself the objective of creating a tool that was clear and simple to use, but at the same time comprehensive, in order to guarantee rapid and immediate consultation of the data from a mobile phone.
The features
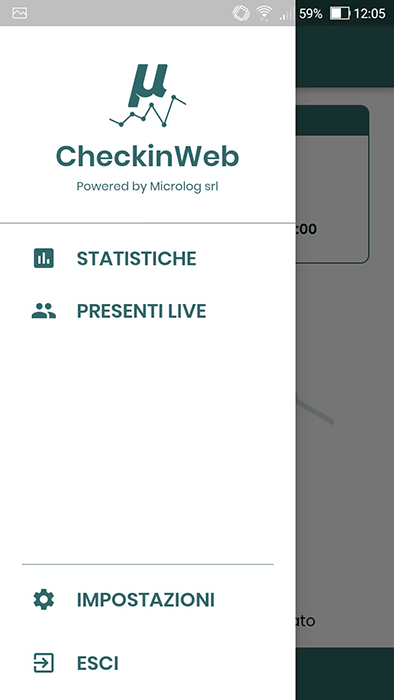
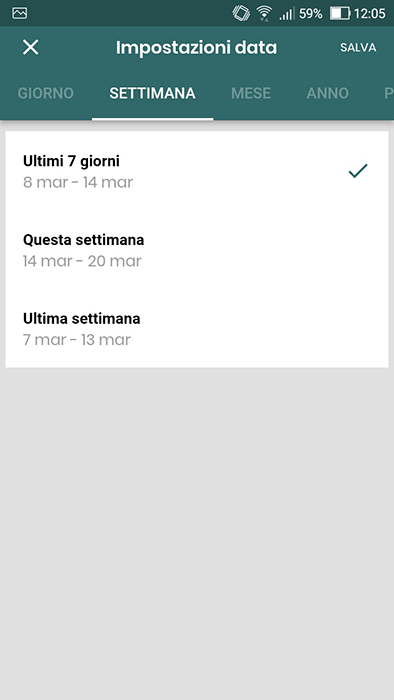
Within the app’s new section – easily accessed via the side menu – statistics can be viewed by selecting different time details (day, week, month, year), and to speed up user action there are preset dates to choose from, for example: “This week”, “Previous week”, and so on. In this way it will be possible to view the data quickly, with just a few taps on the phone screen.
Obviously (as in the browser version) there are interactive graphs, which allow you to view the details of a period simply by touching the line. There is also the possibility of selecting the data display for zones, sensors and groups of plants, previously created on the web platform.
How to get it?
With this update, Microlog gives further impetus to the services and software packages offered to its customers. Not only people counters and management systems then, but also advanced analysis platforms and cutting-edge applications that allow the customer to monitor the situation at all times and optimise the business.
Se ancora non la possiedi, ecco i link per scaricare gratuitamente la nostra App:


For any detailed information please do not hesitate to write to us:


Write a comment (Your email will not be published and will remain confidential)