Negative first week for the 2022 summer sales on 2019 from the point of view of entries. Better instead on 2021! Let’s see the detail…
In this short article we look at the footfall data for this start of the 2022 summer sales. In particular, we analyse the percentage trend of admissions in those Shopping Centres and Outlets served by Microlog people counters, with reference to the first 8 consecutive days of sales.
Considering the very peculiar period we are going through, between the new wave of Covids and the economic consequences of the conflict in Ukraine, there was a lot of expectation for this beginning of July, after two consecutive months that saw the turnouts picking up.
Unfortunately, when analysing the data, we have to note that we are still a long way from the number of admissions compared to the 2019 sales, while the trend on 2021 opens up positive considerations.
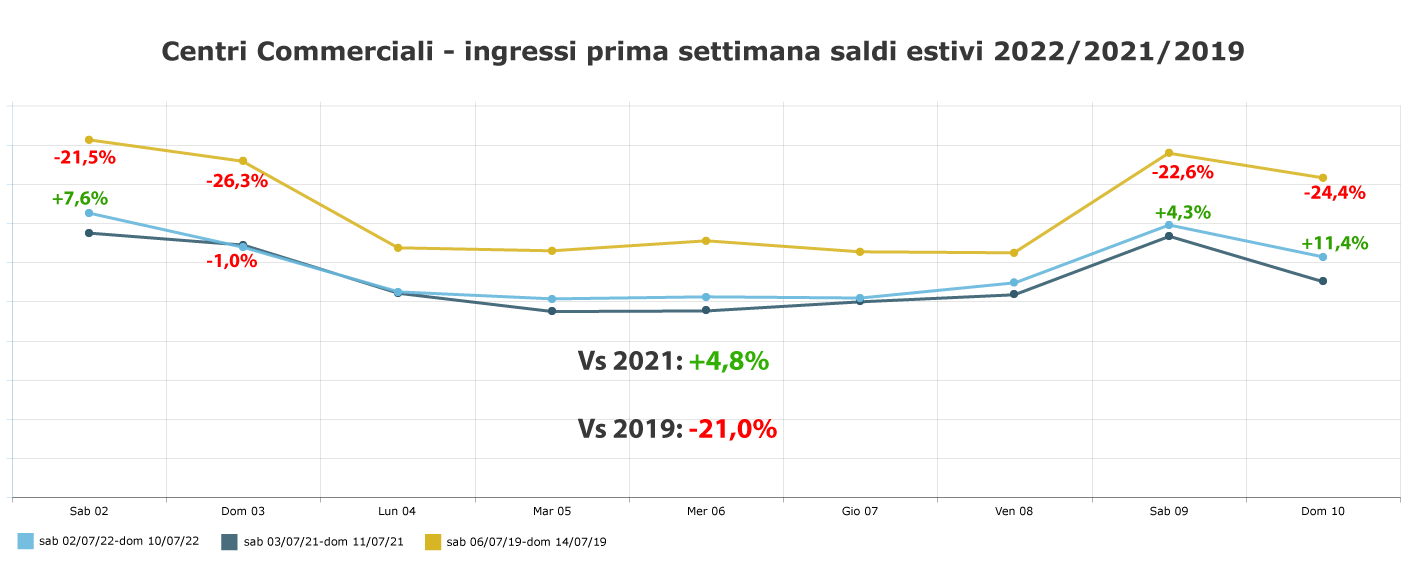
Malls give up -21.0% on 2019 and gain +4.8% on 2021
From the graph, one can already see at a glance a significant deficit of the Galleries compared to 2019: -21% on average, with a peak of -26.3% on the first Sunday of sales. The second weekend is also in line with the first, without any substantial differences. On the other hand, the performance on 2021 was positive, with +4.8% on average and a positive peak of +11.4% on the second Sunday of sales. Admissions are still far from pre-covid year, but there is an improvement on the previous year.
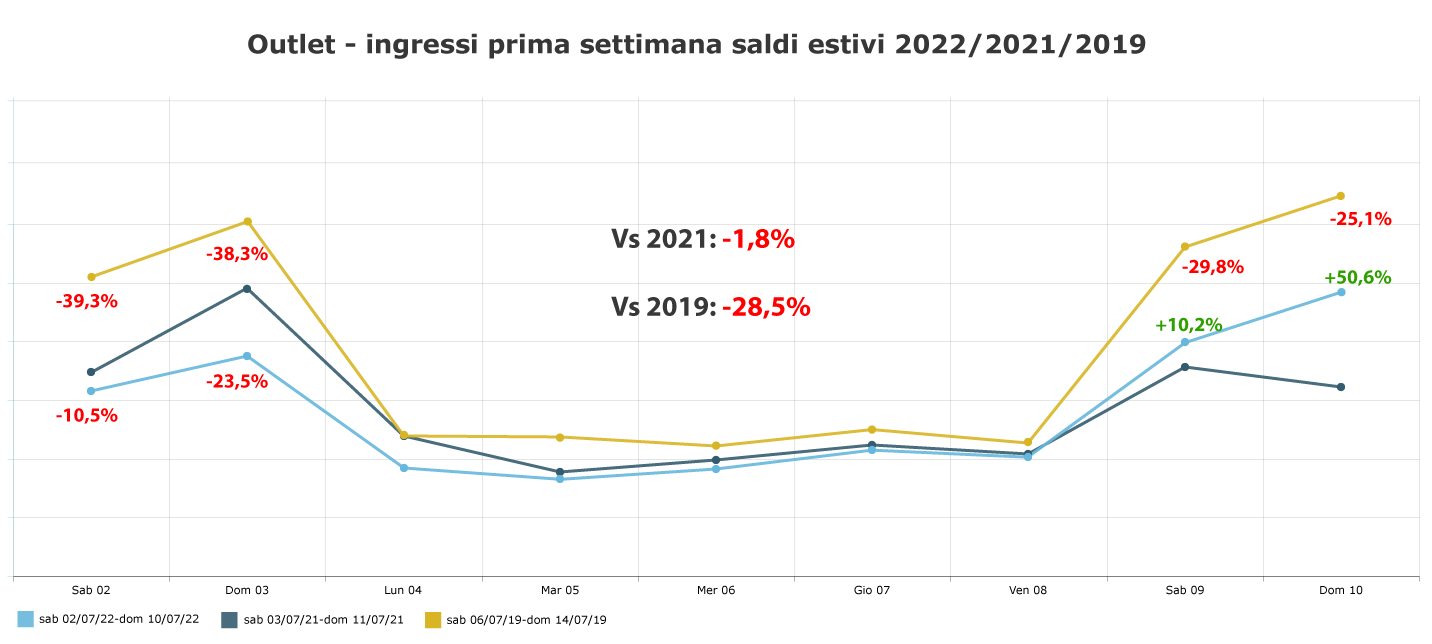
Retail Outlet footfall lose -28.5% on 2019 and -1.8% on 2021
Turning to the outlets, with specific reference to those monitored by our people counters, we highlight an even greater drop compared to the Shopping Centres: on 2019 the average gap is -28.5%, with a fairly evident gap, especially in the first weekend of sales, which is close to -40%. On the other hand, however, we underline an improvement in the second weekend, with the gap on 2019 decreasing, but above all with a positive leap compared to 2021: +50.6% of entries on Sunday 10 June on the aligned Sunday of the previous year, with the average gap on 2021 being only slightly negative (-1.8%).
How should these data be interpreted?
As expected, the current economic situation does not yet allow footfall to catch up with pre-covid years. But the positive signs are there: the + sign compared to 2021 for Malls, and the substantial parity for Outlets, suggest the will not to be discouraged by Italian families, but above all the desire for a reasoned and savings-oriented shopping, in line with the current purchasing power available.


Write a comment (Your email will not be published and will remain confidential)