Heat Map – In-store analytics, Hot zone
People tracking: measure the “temperature” of your store and traffic path
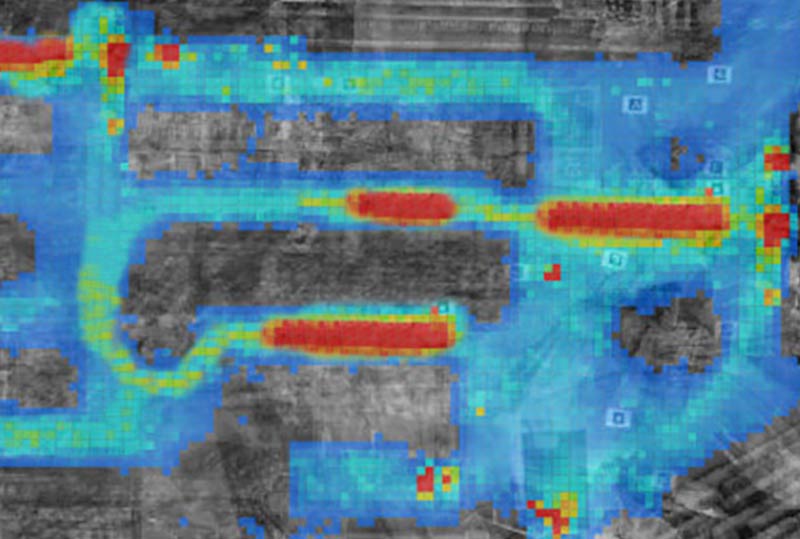
A Heat Map is useful for visualizing the most frequented areas of a point of sales through time in an intuitive and immediate way.
The system is able to identify the visitor’s preferential paths, in order to detect the fundamental information to understand what are the elements that influence the choices of the typical customer. Moreover, it also allows to estimate the time spent in each specific area. The data are stored anonymously and securely.
By analyzing the data collected it is possible to increase profitability and total turnover, identifying in the sales point those circumstances that best motivate and satisfy the customer in his/her shopping experience.
Technology
Sensors: camera, 3D sensor
Main KPI: hottest zone, traffic path
Aims
- What is the average time spent by visitors in the various areas?
- Which are the most visited areas and traffic paths?
- How could you improve profitability by changing the store layout?
- Are your products clearly visible (with reference on customers’ habits)?


